How to Read a Solar Savings Estimate in NZ (and How Far to Trust It)

About $2,000 to $3,500 a year. That is what a typical 6.6 kW home solar system can save in New Zealand, with power bills usually coming down by 50% to 80% and payback in about 4 to 6 years. These are typical estimates, not a promise for any one home. Finding out where your own home sits takes seven questions and about 60 seconds on our free solar calculator, and your personalised estimate is emailed within 24 hours.
A number on its own does not tell you much, though, until you know what went into it.
This guide follows the calculator's questions in order: what each answer changes, how far to trust the result, and what to do next. If you would rather talk it through with a person first, call us on 0800 288 333.
What Does a Solar Savings Estimate Actually Tell You?
A solar savings estimate takes a few facts about your property and your power use and turns them into two things: a recommended system size and a figure for what that system could save you each year.
It is a starting point, and nothing in it commits you to anything. It answers the question most people have first: is solar worth looking at for my place?
It is not a quote, and it is not a design; both come after someone has seen the property.
Which Answers Shape Your Estimate, and Why?
Our calculator asks seven questions about your property, then your contact details so we can send the estimate. None of them need paperwork, and several have a "not sure" option. What matters for reading the result is what each answer does to it.

| Question | What it mainly changes | Required? |
|---|---|---|
| Monthly power bill | The recommended system size | Yes |
| Property type | The kind of installation, and how provisional the estimate is | Yes |
| Roof direction | How much the system can produce, and at what time of day | Yes |
| Roof type | How the panels are mounted | No |
| Shading | How much the system can produce | No |
| Daytime usage pattern | How much of your solar you use yourself, and so the savings figure | No |
| Battery interest | Whether storage is planned into the system | No |
Three of the seven are required: the monthly bill, property type and roof direction. The other four are optional, but each answer narrows the estimate.
Why Does Your Monthly Power Bill Matter Most?
Your power bill is the calculator's best picture of how much electricity your household uses. A bigger bill usually means more usage, which a larger system can put to work.
The calculator asks for a band, not an exact figure, because bills move around through the year and a rough average is more useful than last month's number.
There are seven bands in all: under $100, $100 to $150, $150 to $200, $200 to $300, $300 to $400, $400 to $500, and $500 and over.
A quick tip: a July bill in Christchurch with the heat pump running looks very different from a February one, so pick the band that matches your yearly average.
If gas or broadband sits on the same bill, count only the electricity part, because that is what solar can offset.
What Do Property Type and Roof Type Tell the Calculator?
They tell us what kind of installation we are probably looking at, before anyone has climbed a ladder.
Property type sets the starting frame. A standalone house usually has the most roof and the simplest decisions. Townhouses and apartments can involve shared roofs or body corporate rules, so the estimate is more provisional. A rural or lifestyle block often has room for a larger system, and commercial property brings different usage hours altogether.
Roof type is about how the panels are fixed in place. A metal roof such as Colorsteel is generally the most straightforward to mount on. Concrete and clay tile take more care, because tiles need to be worked around when the mounting goes in. A flat roof usually needs frames to tilt the panels towards the sun. If yours is none of these, choose "other" and the roof is confirmed at the on-site assessment.
Neither answer shifts the savings figure much on its own. What they change is how firm the estimate is and what the installation involves, which shows up later in your quote, not in the emailed numbers.
How Much Do Roof Direction and Shading Change the Result?
Quite a bit, which is why they both get their own question.
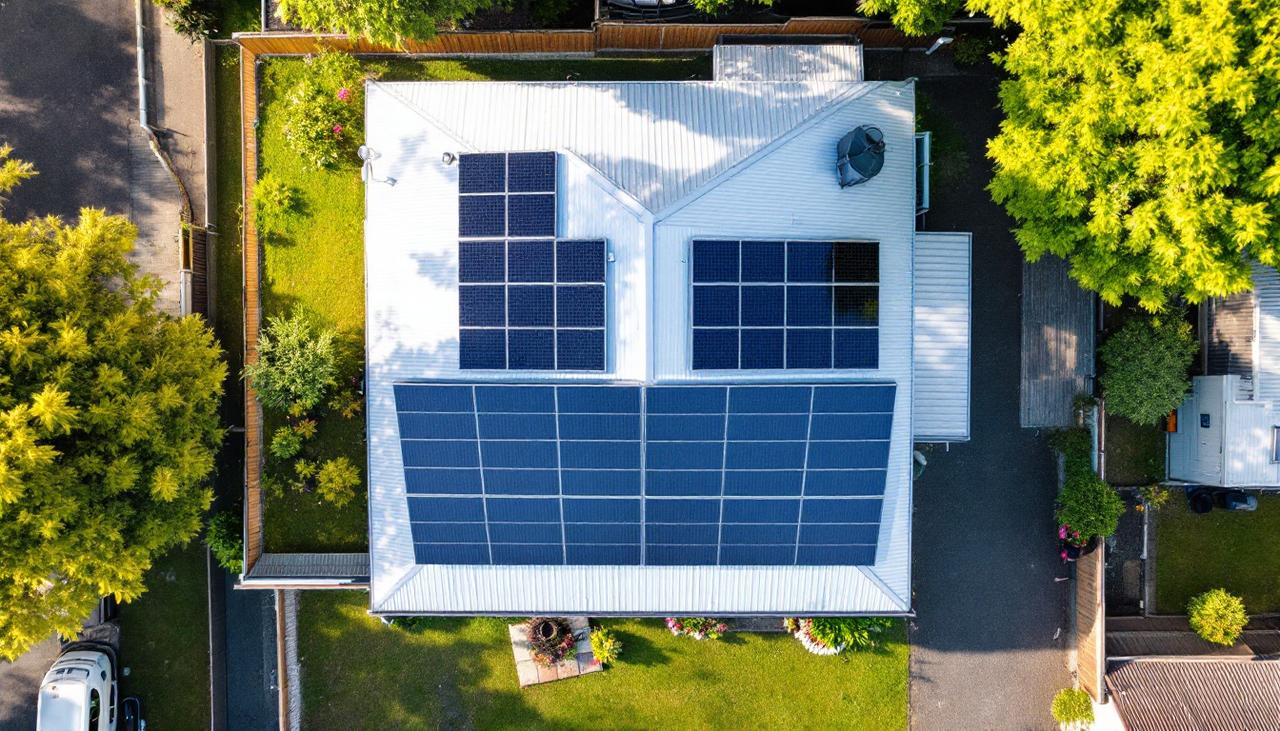
In New Zealand, a north-facing roof catches the most sun across the day, so the calculator lists it as the ideal option. North-east and north-west are close behind. East and west roofs still work well for plenty of homes: they produce less in total but spread it differently, east favouring the morning and west the late afternoon. For a household that is busy at breakfast and dinner, that spread can be a real advantage.
Most houses have more than one roof face, so answer for the face with the most clear, usable space. You will notice the list has no south option. If south is the only direction your main roof faces, choose "not sure", and the on-site assessment will check whether another face, a garage or a carport could carry the panels.
Shading is the other half. The calculator gives you five options to pick from: no shading, light shading (trees nearby), moderate shading, heavy shading, and not sure. Even a small shadow across part of an array can pull down output, and shade changes with the seasons as the sun sits lower in winter.
A simple way to judge it: look at the roof mid-morning, around midday and mid-afternoon on a clear day. If nothing falls across it at any of those times, "no shading" is a fair answer. A shadow that touches one corner for part of the day is light. A tree, chimney or neighbouring building that covers a good share of the roof for a few hours is moderate shading; if it covers most of the roof for most of the day, choose heavy shading.
If you check in summer, remember the winter sun sits much lower, so a tree that clears the roof in January may reach it by June. When in doubt between two shading options, the more cautious one gives you an estimate you are less likely to be disappointed by.
Why Does It Ask When You Are Home During the Day?
Because solar power is worth the most when you use it yourself. Power you use while the sun is up replaces power you would otherwise buy at the full retail price; power you do not use goes out to the grid at a buy-back rate, which is generally lower.
So two homes with the same roof and system can save different amounts.
The calculator gives you four choices: someone home all day, empty during work hours (9 to 5), variable or working from home some days, and EV charging needed. That last one matters because charging a car is a large load that you can often shift into the sunny part of the day.
This question has no "not sure" option, so pick the closest fit. If your week is a mix, choose variable. Answer honestly: saying someone is home all day when the house is usually empty makes the savings figure look better than the system can deliver.
This guide is about reading the estimate, not filling in the form. Step-by-step use of the calculator, retailer buy-back rates and ways to push your savings higher are covered in our guide to solar savings and power company buy-back rates, worth reading alongside this one if your home is empty most of the day.
Should You Include a Battery in Your Estimate?
Pick whichever option is closest to how you feel right now; the calculator offers four answers: yes, include a battery; battery-ready for later; solar only for now; and not sure yet.
If your home is empty during the day and busy in the evening, a battery lets you store daytime solar and use it after dark, so it is worth including in the estimate. If you are home most of the day and already use much of what you produce, solar only may be the tidier starting point.
"Battery-ready for later" is the middle path. We plan for a battery from the start, which usually means a hybrid inverter that manages both panels and battery, so storage can be added later without swapping the inverter.
A battery lifts the share of your own solar you use, which tends to raise the yearly saving, but it also adds to the system cost, so payback can move either way.
What Do Typical Results Look Like for NZ Homes?
Here are the typical figures we quote for an average household with a 6.6 kW system, to hold your own estimate against.
| Figure | Typical result for a 6.6 kW home system | Where you will see your own |
|---|---|---|
| Estimated yearly savings | About $2,000 to $3,500 | Your emailed estimate |
| Bill reduction | About 50% to 80% | Your system design |
| System cost | About $10,000 to $14,000 | Your quote after the on-site assessment |
| Payback | About 4 to 6 years | After the on-site assessment |
The calculator page also shows three example homes, based on typical Auckland properties, so you can see which one your own recommendation sits closest to.
| Example home | System size | Panels | Annual output | Estimated yearly savings | Bill reduction | Payback |
|---|---|---|---|---|---|---|
| Small home | 4 kW | 9 | About 5,200 kWh | About $1,500 | About 55% | About 5.5 years |
| Average home | 6.6 kW | 15 | About 8,600 kWh | About $2,800 | About 70% | About 4.5 years |
| Large home | 10 kW | 22 | About 13,000 kWh | About $4,200 | About 80% | About 4 years |
If your estimate comes back well above or well below the range for a home like yours, one of your answers, often shading or daytime use, is usually doing a lot of the work.
How Do You Read the Numbers in Your Own Estimate?
The estimate we email you gives two numbers: a recommended system size and an estimated yearly saving for your home. Start with those.
System size, in kW, is the capacity of the panels we suggest. It is matched to the household usage your bill band points to. Roof direction and shading come in on the output side: they change how much that system is expected to produce, which is how they reach the savings figure.
Estimated savings is the dollar figure most people look at first. The calculator page notes that actual savings depend on roof orientation, usage pattern and system size, and the usage pattern decides how much of your solar you use yourself, which is why the daytime usage question carries so much weight.
Three more figures add context. They are not in the emailed estimate; the tables above give typical ranges.
- Annual output, in kWh, is how much electricity a system is expected to produce over a year. Read it as a yearly total, not twelve equal months: a system produces far more in summer than in winter.
- Bill reduction is the share of your yearly power bill the system is expected to offset. It stops short of 100% for a grid-connected home, because you still buy power at night and on dull days, and your retailer's fixed daily charge stays on the bill.
- Payback is how long the yearly savings take to cover the cost of the system, and the size, roof and battery choices in your design move it.
What If Your Estimate Looks Too High or Too Low?
Go back over your answers before you doubt the result. An estimate that seems low often traces to one cautious answer: a bill band below your real yearly average, moderate shading chosen for a roof that is clear for most of the day, or "empty during work hours" for a home where someone is in three days a week. One that seems high usually runs the other way.
If one was a guess, check it first: bill band, then daytime usage, then shading. Those three move the savings figure most.
How Far Can You Trust a Solar Savings Estimate?
Far enough to decide on the next step. Before you sign anything, you will want figures taken from your actual roof.
Our calculator draws on NIWA solar irradiance data, current electricity rates from major NZ retailers and performance from systems we have already installed in New Zealand.
The sunshine side is the part to keep in mind. The form does not ask where you live, so your estimate works from one typical sunshine assumption, not a figure for your region or a measurement of your street, and the three example homes are worked on Auckland conditions. If you are in Christchurch or Wellington, read the results as a guide to scale, not as your local numbers. Output and savings are reworked for your own location at the on-site assessment.
How firm your own result is also depends on what you put in. If you answered all seven questions with a definite option, treat the estimate as a fair first picture. If two or three were "not sure" or blank, hold it more loosely: the system size usually stays in the right area, because the bill band drives it, but the savings figure has more room to move.
There are things no online form can see, though:
- The exact usable area of your roof, and what is in the way (skylights, vents, aerials)
- The age and condition of the roof and the switchboard
- Shade that only shows up at certain times of year
- Your real usage hour by hour, which a power bill total hides
- Sunshine at your own site, as opposed to a typical assumption
That is why a free on-site assessment comes before any design is locked in.
Want to skip straight to that step? Call us on 0800 288 333 with a few details about your home, and we will set up a time to look at your roof.
For an independent view, the Energy Efficiency and Conservation Authority is a good government source to read alongside any installer's numbers.
What Should You Check Before Comparing Two Estimates?
Check that both started from the same assumptions. Two estimates for one house can differ widely without either being wrong.
Line up the system size, how much of the solar each assumes you use yourself, and whether a battery is included. Then check what each is built on: an online form is a guide, and a roof visit is the basis for a decision.
Look at the bill figure behind each one as well. An estimate built on a $250 monthly bill and one built on $350 will suggest different system sizes for the same roof.
What Happens After You Hit Calculate?
Your personalised estimate is emailed within 24 hours of hitting calculate.
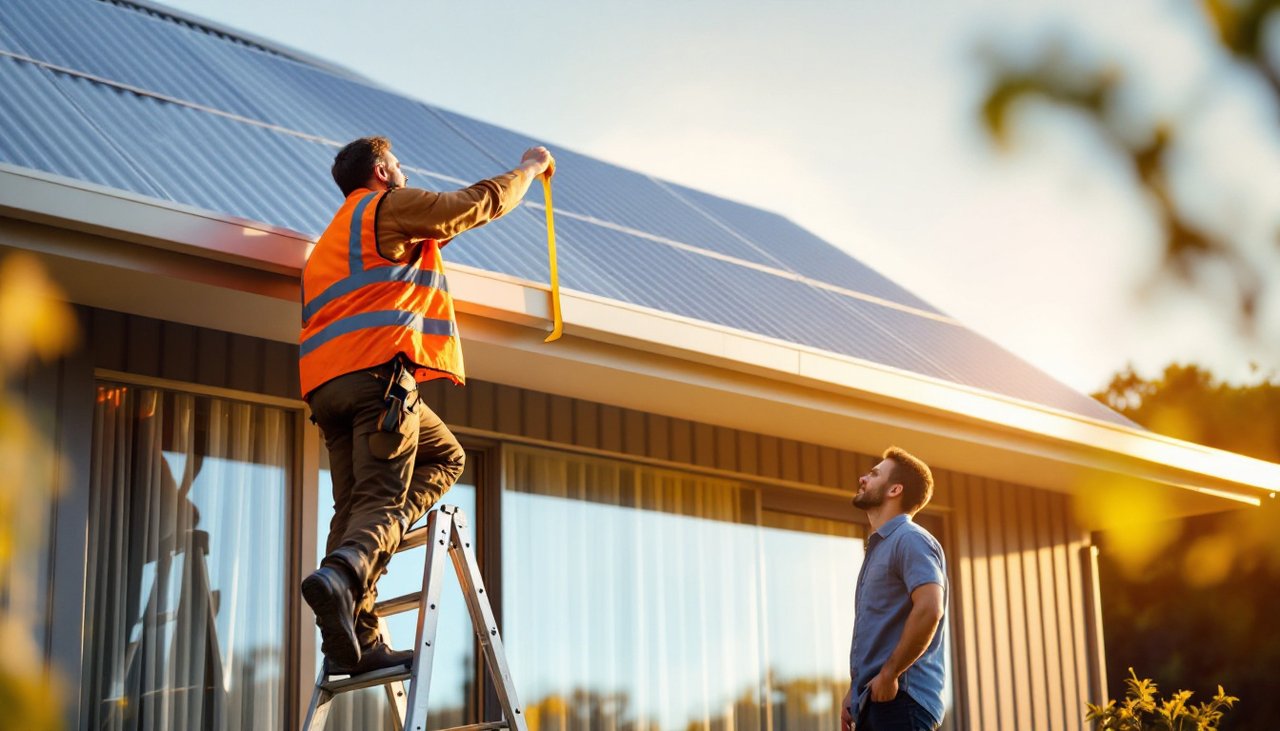
Some people park the estimate until the timing is right. Others want exact figures, and that is where the on-site assessment comes in. We look at the roof, the switchboard and your usage, then design a system around them: panel layout, inverter choice and whether a battery belongs in the plan.
What Else Do People Ask Before Requesting an Estimate?
Do I need my power bills in front of me?
No. The calculator asks for your average monthly bill as a band, such as $200 to $300, so a reasonable estimate from memory is fine. If your bills swing a lot between summer and winter, pick the band closest to your yearly average.
What if I do not know which way my roof faces?
Choose "not sure". A quick check on a map app will usually show you which side of the house faces north, and roof direction is one of the things looked at properly during the on-site assessment.
Can I use the calculator for a business?
Yes, commercial property is one of the property types you can select. Commercial systems typically save about 50% to 70% on electricity and pay back in about 4 to 8 years, but the figures depend heavily on when your site uses power, so a business estimate is always followed by a closer look at your usage.
Do I have to give my phone number?
No. The form needs your name and email so the estimate can be sent to you, and the phone field is optional. Add it if you would prefer a call to talk through the result.
Ready to See Your Own Numbers?
The quickest way to see your own numbers is the free solar calculator NZ homeowners can fill in from any device: seven questions, about 60 seconds, and your estimate arrives by email within 24 hours. If you already want exact figures, call us on 0800 288 333 to book a free on-site assessment, and we will design a system around your actual roof and usage. You can also drop into one of our showrooms in St Johns or Rosedale in Auckland, or Hornby in Christchurch.