Why Your Solar System Might Be Underperforming in NZ (And How to Spot It)
Your last three power bills did not drop the way your installer said they would. The dashboard app shows slightly lower kWh than last summer. The inverter is running, the panels look clean from the ground, and nothing on the system has thrown a visible alarm. But the savings are not there.
This is the most common complaint we hear from NZ solar homeowners once a system is two or more years old, and it almost always has a fixable cause. Underperformance rarely means the system has failed. More often, one or two small issues are quietly dragging down what should be a 25 year investment.
This guide covers the eight most common reasons an NZ solar system underperforms, a 20 minute check you can run yourself today, and when to book a professional diagnostic. Everything here is drawn from real audits on Auckland, Waikato and Bay of Plenty homes.
Not sure if your system is actually underperforming?Book a free system health check with Apollo Energy and we will compare your output against what the panels on your roof should be producing.
What a properly working NZ solar system should actually produce
Before you diagnose a problem, you need to know what normal looks like. NZ averages 3.8 to 4.3 peak sun hours per day, varying by region and season. A well installed 6.6kW north facing array in Auckland typically produces:
- Summer (Dec to Feb): 28 to 34 kWh per day
- Autumn (Mar to May): 18 to 24 kWh per day
- Winter (Jun to Aug): 10 to 14 kWh per day
- Spring (Sep to Nov): 22 to 28 kWh per day
Over a full year, that adds up to 8,500 to 9,800 kWh, or roughly 1,300 to 1,500 kWh per installed kW. For smaller systems, our guide on how much power a 5kW solar system produces in NZ breaks the numbers down by season and region.
If your production is 15 percent or more below these ranges across multiple billing cycles, something is worth investigating.
Quick takeaway:
- Use kWh per installed kW per year as your benchmark (target 1,300 to 1,500).
- Compare at least three months, not one.
- Seasonal dips are normal; sustained underperformance is not.
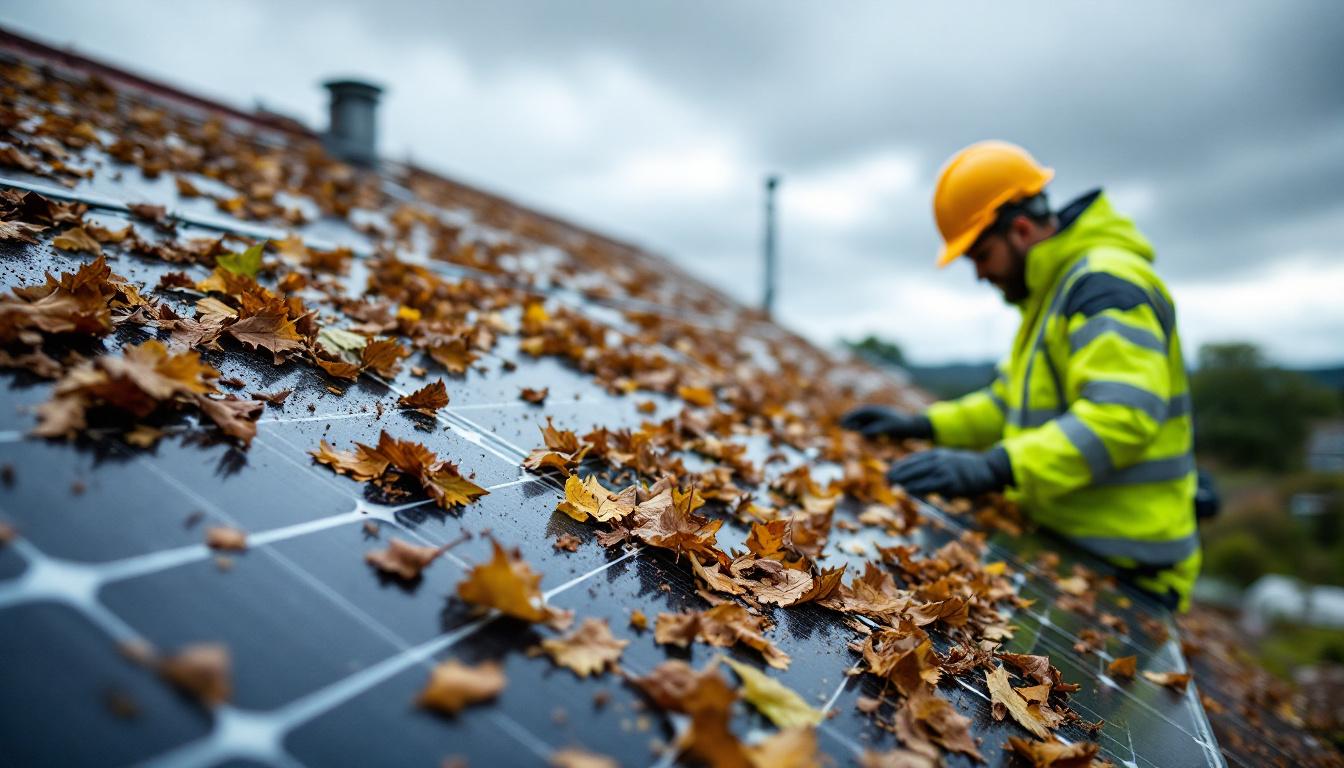
1. Dirty or partially shaded panels
This is the top cause of lost output in NZ, and the easiest to fix. Coastal homes collect salt haze, rural properties pick up pollen and dust, and anywhere near native trees accumulates bird droppings and leaf matter. Even a thin film across a panel can drop output 5 to 15 percent.
Shading is sneakier. A tree that was fine at install may now clip the array for two hours in winter when the sun is low. If your array uses a single string inverter, shading on one panel can drag down the whole string.
Signs it is shading or soiling:
- Output is fine at midday but falls off sharply morning or late afternoon.
- Winter output is disproportionately worse than summer, beyond normal seasonal variation.
- Visible buildup on the panels from an upstairs window.
Takeaway: clean panels once a year (twice if coastal or under trees), trim branches that have grown since install, and ask whether panel level optimisers would help if shading is permanent.
2. Inverter fault or ageing components
Inverters are the hardest working part of your solar system. They run every daylight hour and typically last 10 to 15 years, less than the panels themselves. Common NZ inverter issues include capacitor wear (quiet efficiency loss, no error shown), fan failure causing heat throttling (output drops mid afternoon), firmware bugs on older Goodwe and Growatt units, and isolator tripping without anyone noticing.
A surprising number of NZ homeowners do not realise their inverter has been in fault mode for weeks because the monitoring app either lost connection or shows an ambiguous "no data" state rather than a clear fault.
Takeaway: check the physical inverter screen at least monthly (not just the app). An inverter that is hot to the touch in afternoon sun is throttling. Budget for inverter replacement around year 10 to 12.
3. Panel degradation beyond expected rate
Quality tier 1 panels degrade roughly 0.4 to 0.7 percent per year. Over 10 years that is a 5 to 7 percent natural loss you should expect. Cheaper panels can degrade above 1 percent per year, and micro cracks from hail or wind stress can push a single panel to 10 percent loss inside three years.
Delamination (the protective film separating from the cell) is visible from the ground as a cloudy or yellowed patch. Hot spots are only detected with a thermal camera.
This is where installer choice matters most. Our tier 1 solar panel range all carry 25 year performance warranties, which means any panel that falls below its rated curve is replaced.
Takeaway: degradation above 1 percent per year is a warranty conversation. Micro cracks are real and not always visible. Thermal imaging during an audit catches hot spots a visual inspection misses.
4. Wiring, connectors, or isolator issues
MC4 connectors (the snap together plugs between panels) fail more often than people realise, especially when moisture gets in. DC isolators have had a chequered history in NZ, with several recalls over the last decade. A poor crimp anywhere in the string can cost 3 to 8 percent of output and is invisible from the ground.
Warning signs:
- Output fluctuates randomly during steady weather.
- Isolator housing is discoloured or has melted slightly.
- The inverter occasionally shows a "low voltage" or "arc fault" warning.
This one you do not check yourself. DC side faults are dangerous; leave the isolator closed and call a qualified installer.
Takeaway: random output dips are often a connector, not a panel. Ask whether your isolators are on any current NZ recall list.
5. Suboptimal tilt or orientation for your site
In NZ, north facing is the default, but "north" is relative to your actual roof. East and west facing arrays still produce well, just never hitting the same daily peak as a true north facing array. If your installer split panels across two orientations to fit more on the roof, expect a flatter production curve through the day rather than one tall midday peak.
Tilt matters too. A low roof pitch (10 to 15 degrees) works fine in summer but loses significant winter output. A steeper pitch (25 to 40 degrees) is the NZ sweet spot.
Takeaway: roof aspect cannot be changed without re racking, so factor this in at install. Flat curve production is normal for split orientation arrays. A steep north facing roof beats a flat one for year round output.
6. Undersized system for how you actually use power
This is not a fault, it is a design issue. A 5kW system on a two person apartment is oversized. The same 5kW on a five person home with ducted heat pump, EV and hot tub is undersized, and no amount of cleaning or servicing will fix that.
We see this pattern often when a homeowner buys an EV two years after installing solar. The system was sized for pre EV loads, and now the EV is drawing from the grid every night.
If this sounds like you, browse our home solar systems range to see the sizing options for higher load NZ households, or talk to us about adding panels to what you already have.
Takeaway: an "underperforming" system may be correctly performing but undersized. Major new loads (EV, heat pump, pool) change the sizing calculation. Adding panels to an existing array is often cheaper than a full replacement.
7. Monitoring gaps and data you are misreading
Plenty of "my solar is broken" calls turn out to be monitoring issues. The app lost WiFi two months ago. The inverter is reporting in kW but the app is showing kWh. The totals reset after a firmware update. The dashboard is showing self consumption but not total generation.
Before assuming hardware is at fault, sit down with your inverter's direct readout and a meter. If those agree and the app disagrees, the app is the problem.
Takeaway: always cross check app data with the physical inverter display. WiFi dropouts can corrupt trend data without breaking anything. A lifetime kWh counter is more reliable than a daily figure.
8. Battery or load management mismatch
If you have a battery, there are extra ways to lose value even when the panels are fine. Batteries set to charge only from excess solar will sit mostly empty in winter. Batteries on an "always full" setting will charge from the grid at peak rates, costing you more than the solar saves. Time of use tariffs without a tariff aware battery controller leave money on the table every day.
This is often a configuration issue, not a hardware one, and is one of the most common fixes on our audits. If you are considering adding a battery, or rethinking how an existing one charges, our solar battery systems page covers the hardware options, and our deeper guide on solar battery storage in NZ explains how to match a battery to your usage profile.
Takeaway: a battery set incorrectly can cost more than no battery at all. Tariff aware controllers are essential on time of use plans. Battery audits take 30 minutes and often recover 10 to 20 percent in savings.
How to check your system yourself in 20 minutes
Not sure whether you have a real problem yet? Work through this sequence before calling anyone:
- Compare the last 12 months of power bills to the 12 months before install. Savings should be obvious on a monthly basis.
- Pull up your solar app and check total kWh for the last 30 days. Divide by 30 for a daily average.
- Compare that daily average to the seasonal ranges earlier in this guide, adjusted for your system size (divide by installed kW).
- Walk outside and look at the panels from an upstairs window. Note any visible dust, streaks, leaves or bird droppings.
- Check for tree growth that was not there at install.
- Look at the inverter display. Is it showing normal output during sunshine? Any warning icons or fault codes?
- Check the isolator housing. Intact, no melting, no discolouration.
- Record your readings. If you call an installer, they will ask for these numbers anyway.
Our solar maintenance checklist on what to check quarterly and annually walks through the same diagnostic flow with extra detail on detecting underperformance early. The post is framed for commercial systems but the checks apply directly to residential.
When to call a professional
Book a professional audit if any of the following apply:
- Output is 15 percent or more below expected ranges across three or more months.
- You can see visible damage on panels, isolators or wiring.
- Your inverter is more than 8 years old and has never been serviced.
- You added significant new loads (EV, heat pump, hot tub) without sizing the system up.
- Your battery is more than three years old and has never been recalibrated.
What a proper underperformance audit covers
At Apollo Energy an audit is a single half day site visit that includes:
- Full string and panel level output measurement under live load.
- Thermal imaging of every panel to detect hot spots and micro cracks.
- Inverter efficiency test and firmware check.
- DC isolator and wiring inspection, including recall cross check.
- Battery state of health test if a battery is fitted.
- Tariff and self consumption review against your current power plan.
- A written report with specific findings and the recovery value of each fix.
Most audits pay for themselves in the first year through recovered output and smarter tariff use. See the full scope on our solar services page.
Ready to find the 10 to 20 percent of output you are probably losing?Get a no obligation audit quote and we will come to your home with thermal imaging and full test gear.
Frequently asked questions
How do I know if my solar panels are underperforming?
Divide your last 12 months of kWh production by the number of installed kW. A well performing NZ system produces 1,300 to 1,500 kWh per installed kW per year. Anything below 1,100 suggests an underperformance issue worth investigating.
Can solar panels stop working without warning?
Yes. Many failures (dirty panels, connector faults, firmware issues, battery miscalibration) produce no alarm. The only way to catch them is by comparing real output to expected output, not by waiting for an error message.
How often should I service my solar system?
A visual clean once a year, a full electrical and performance check every three to five years, and an inverter service around year eight to ten. Batteries should be recalibrated every two years minimum.
Is a drop in solar output always a sign of failure?
No. Winter output is naturally lower, and a cloudy month will reduce totals. What matters is whether your annual kWh per installed kW is on target compared to previous years.
Does cleaning solar panels actually improve output?
In NZ conditions, a thorough clean on a dirty array typically recovers 5 to 10 percent output. More if you are coastal or under trees. Less if the panels were already fairly clean.
Can Apollo Energy service a system they did not install?
Yes. We audit and service systems from most NZ installers and brands, including systems where the original installer is no longer operating.